The regular Matlab plot() command outputs curvy lines as if they are staircased due to the lack of proper antialiasing. A remedy for this is to use the hidden feature of line properties: LineSmoothing (plot(function,'LineSmoothing','on')). One example is shown below:
LineSmoothingDemo
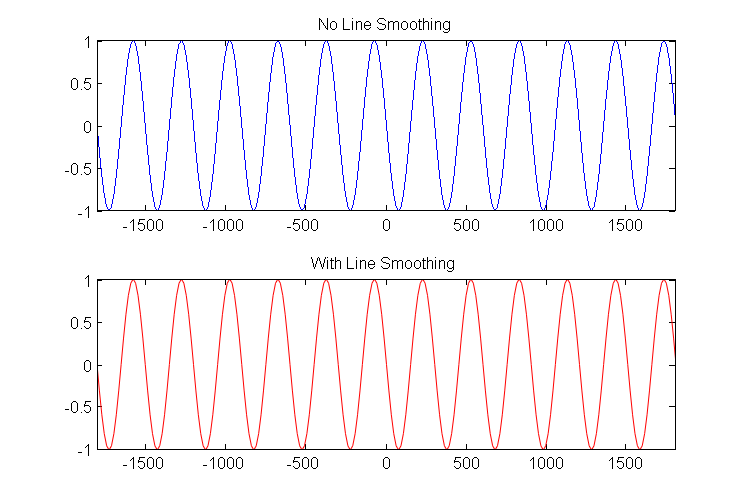
For more information and other tips on Matlab, please refer to the following website: undocumentedmatlab.comclear all; clc; % Simple example showing the Line Smoothing property freq=1e6; % frequency of operation omega=2*pi*freq; % angular frequency T=1/freq; % period Nt=10; dt=T/Nt; c=3e8; % speed of light lambda=c/freq; % wavelength k=2*pi/lambda; % wavenumber Nx=20; dx=lambda/Nx; x=(-6*lambda):dx:(6*lambda); % Evaluate $$ f(x)= sin(\omegat-kx) $$ at t=0 func= sin(omega*0-k*x); % Plot figure(1); clf; set(gcf,'Color',[1 1 1]); subplot(2,1,1); plot(x,func,'-b'); hold on; title('No Line Smoothing'); Xlim([x(1) x(end)]) subplot(2,1,2); plot(x,func,'-r','LineSmoothing','on') title('With Line Smoothing'); Xlim([x(1) x(end)])