In Finite-Difference Time-Domain (FDTD) simulations, source injection needs to be smoothly done in order to suppress the undesired high frequency components excited during turn on. To visualize this problem, we provide two cases with and without turn-on source injection. On the right simulation, total field/scattered field injection is done using the cosine excitation without any smooth turn-on which effectively mimics the step function operation. This results in the injection of high frequency components creating the ripples and fluctuations in the signal propagating in the domain. On the contrary, the left simulation has a smooth turn of by using a half Hanning window ramp-up which effectively acts as low pass filter for the injected source. As a result, the signal propagating in the domain is free of high frequency components, hence no ripples and fluctuations.
Tuesday, September 30, 2014
FDTD simulations - Why Smooth Turn-on of Source is Needed?
In Finite-Difference Time-Domain (FDTD) simulations, source injection needs to be smoothly done in order to suppress the undesired high frequency components excited during turn on. To visualize this problem, we provide two cases with and without turn-on source injection. On the right simulation, total field/scattered field injection is done using the cosine excitation without any smooth turn-on which effectively mimics the step function operation. This results in the injection of high frequency components creating the ripples and fluctuations in the signal propagating in the domain. On the contrary, the left simulation has a smooth turn of by using a half Hanning window ramp-up which effectively acts as low pass filter for the injected source. As a result, the signal propagating in the domain is free of high frequency components, hence no ripples and fluctuations.
Sunday, September 28, 2014
Nehalem Bay from the Neahkahnie Mountain [1,680' (512 m)]
Finally, we had an opportunity to have a family hike this summer. My son, Omer and my daughter, Meryem were with us as well. Omer was walking by himself and Meryem was comfortably carried in my back. After a pleasant hour of walking starting from the south trailhead, we reached to the top of Neahkahnie Mountain. The view of the Nehalem Bay and the Pacific Ocean was stunning. Omer was happy to be at the top and couldn't help but took his selfie.


Friday, September 19, 2014
Mt. Hood Walk Up to 2915 m (9563 ft)
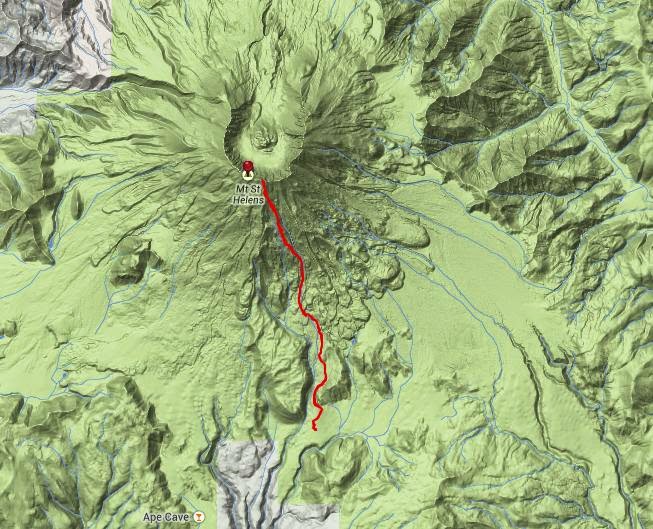
Seems so simple in the GPS track log. But in reality, it poses both physical and mental challenges to walk up to Mt. Hood. And definitely, it requires well studied planning from what to have in your backpack to what to eat before the start etc. After the attempt, I now realize that I wasn't well prepared for the challenge. My crampons were not fitting very well and at every step my mind was preoccupied whether they would get out of my shoes or not. The glasses I brought and started using after 2500 m where not fog proof. So, with the influence of sweat and breath warmth, the glasses became foggy making me half blind. After 2500 m, the wind was strong and the weather got really cold. I didn't have anything to cover my face and it got really cold. Eventually, I started to have headache which grew only bigger. I started to feel so sleepy and they told me that I was going through altitude sickness. Hence I needed to get down as quick as possible. I had to abort the climb. I was ~100 m away from the Hog's Back. Hopefully, next time with better preparation I can do better than this one.
Here are some photos from that day:
Mt. Hood right before the sunset as seen from Timberline Lodge. Getting ready for the midnight walk-up.

The walk-up starts around 1 am and the trail is already full of fellow hikers lighting up the trail.
Sun is rising behind the Mt. Hood. Since we are in the south-west side, we are left in the shade. Mt. Jefferson is seen at the background.
At 2915 m (9563 ft), altitude sickness kicks in. I have a very bad headache and drowsiness. Cannot continue further, need to turn back. This is the last point I was able to reach close to the Hog's Back.
Canyon right on the south of Hog's back.
Mt. Hood
Monday, September 15, 2014
Munra Point Hike (573 m -1879 ft)
Monday, September 08, 2014
McNeil Point Hike at the Mt. Hood National Forest (2118 m ~ 6900 ft)
Here is the video of the last 100 meters of hike past the McNeil point towards Mt Hood from the Cathedral Ridge.
Photos:
Mt Hood from the North side. Glisan Glacier is on the left and Cathedral Ridge to Mt Hood is just in front of us.
Looking northwards. On the horizon, Mt. Adams can be seen.
GPS log of our hike:
Labels:
Cathedral Ridge,
Glisan Glacier,
hiking,
McNeil Point,
Mt. Hood
Thursday, July 31, 2014
Monday, May 26, 2014
Beamforming by Phased Array Antennas
In this second video of the series on beamforming, we show the time domain wave propagation for two phased array antennas at different phase differences. Thanks to the constructive and destructive interferences, the main beam of the wave is steered towards angle of interest.
See also:
Phased Array Antenna Beam Steering Animation (Beamforming)
Beamforming by Phased Array Antennas
Antenas en fase, Antenne réseau à commande de phase, フェーズドアレイレーダー, Фазированная антенная решётка, Фазована антенна решітка, 相位陣列, Szyki fazowane, Fázisvezérelt antennarács, מערך מופע, آرایه فازی
Saturday, May 17, 2014
Selectively Removing the Polar Axis Labels in Matlab
In Matlab polar plots, the default is to show the whole 360 degrees of the whole graph and also include the polar labels up to 360. If some of the labels are desired not the displayed selectively, one remedy is to replace the corresponding strings with empty string. The procedure is pretty simple and I am showing it below.
First assume that we have such a code that plots the polar plot of a radiation pattern of an antenna array.
The resulting plot is shown below where polar labels up to 330 degrees are shown.
First assume that we have such a code that plots the polar plot of a radiation pattern of an antenna array.
set(0,'defaultFigureColor',[1 1 1])

clear all; clc;

freq=1e9;
c=3e8;
lambda=c/freq;
T= 1/freq;
omega=2*pi*freq;
k=2*pi/lambda;

Ns=20;
ds=lambda/Ns;

Nt=25;
dt=T/Nt;
t=0:dt:(1*T);

R=(0*lambda):ds:(8*lambda);
Ntheta=240;
dtheta=2*pi/Ntheta;

theta=0:dtheta:(2*pi);


x=R.'*cos(theta);
y=R.'*sin(theta);

delta=(pi/3);

figure (10); clf;
d = lambda/2;
A = [1 1 1 1 1 1 1]; % Amplitude of each array antenna
Fa=zeros(1,length(theta));
for i=0:(7-1)
    temp =  (A(i+1) * exp(-1i*i*delta + 1i*k*(i*d-3*d)*cos(theta)));
    Fa = Fa + temp;
end
Fa=abs(Fa);
kk=polar(theta,-Fa/max(Fa));   hold on; axis off;
The resulting plot is shown below where polar labels up to 330 degrees are shown.
Assume that we do not want to display the labels larger than 180 degrees, the remedy is simply to find the corresponding handle to that string and then replace it with empty string as shown below.
set(findall(gca,'String','210'),'String',' ')
set(findall(gca,'String','240'),'String',' ')
set(findall(gca,'String','270'),'String',' ')
set(findall(gca,'String','300'),'String',' ')
set(findall(gca,'String','330'),'String',' ')
Wednesday, April 30, 2014
On Suunto Ambit2 - Comparison with an Altitude Post
After using my good old Sony GPS-CS3KA for more than 5 years mainly for the GPS track logs and photo-tagging, I finally upgraded to a more functional gadget, namely the Suunto Ambit2. While I wanted to keep the GPS logging alive, I also wanted to learn and record about my heart rate during long hikes (or any other sports) as well as immediate altitude and temperature info. After a little bit of research online, all fingers pointed to Suunto Ambit2 for increased functionality and exceptional battery life for extended adventures. Hence I decided to buy one and did so recently.
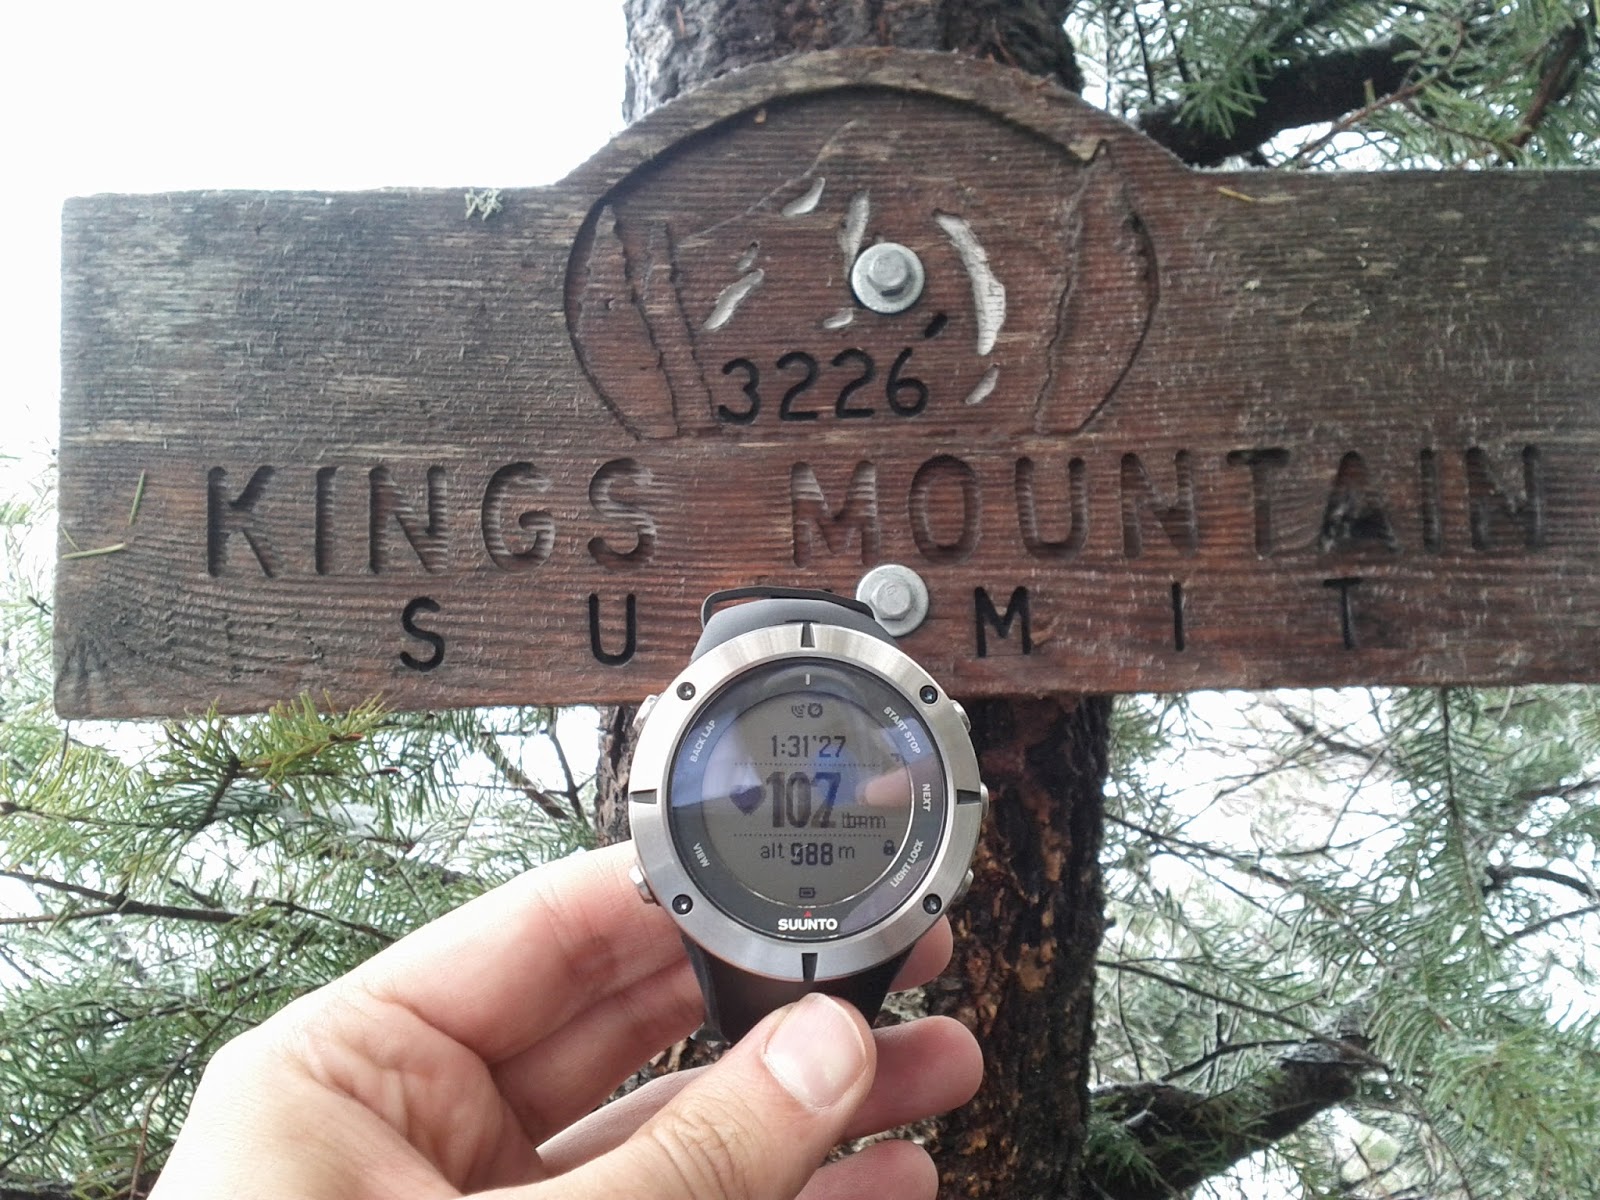
So far, I was able to use Ambit2 in several hikes (including our hike to the top of Mt. St. Helens) and bike rides and I can definitely say that GPS logs rendered by Ambit2 are much smoother than those of the Sony GPS-CS3KA. I plan to prepare a comparative post on the GPS log performances but for now I just have the following photo where I hold the Ambit2 next to the altitude post at the peak of King's Mountain in the Tillamook region of Oregon. Note that the post reads 3226 feet which is equal to 983.2 meters making it 5 meters off from the Ambit2's reading of 988 m (in other words Ambit2 reads 3241 ft whereas the post states 3226 feet). I cannot verify the accuracy of the post but 5 meter difference should be okay.
Edit: Approximately one month later, we were in the summit again and I had the chance to record the summit moments with a GoPro.
So far, I was able to use Ambit2 in several hikes (including our hike to the top of Mt. St. Helens) and bike rides and I can definitely say that GPS logs rendered by Ambit2 are much smoother than those of the Sony GPS-CS3KA. I plan to prepare a comparative post on the GPS log performances but for now I just have the following photo where I hold the Ambit2 next to the altitude post at the peak of King's Mountain in the Tillamook region of Oregon. Note that the post reads 3226 feet which is equal to 983.2 meters making it 5 meters off from the Ambit2's reading of 988 m (in other words Ambit2 reads 3241 ft whereas the post states 3226 feet). I cannot verify the accuracy of the post but 5 meter difference should be okay.
Saturday, March 29, 2014
Mount St. Helens Hike (~8287 ft)
Mount St. Helens Hike
This was my second attempt to hike up to the Mount St. Helen's peak which is at 2526 m (8287 ft). Almost exactly 1 year after the first ascent, this time our group was only 3 people which was a big reduction compared to last year's 8 people. Similar to our group, the parking lot at Marble Snow Park also had much less cars/campers compared to last year. For the record, the starting altitude was 886 m, so roughly 1500 m was ahead of us.
Being a smaller group, we were faster to pack and start the hike in the morning. It was 6.40 am when we were in the trail. After two hours clouds started to come over the St. Helens but later on they were completely gone. It took almost 6 hours to reach the top, the view was gorgeous. The smoke from the volcano was on. The view of Mount Rainier and Mount Adams was great. Here are some snapshots from the top:

Tuesday, February 18, 2014
What happens if the Source is Inside the PML region in FDTD simulations?
In most of the FDTD simulations, perfectly matched layers play an indispensable role by their ability to absorb the incoming waves to mimic free space propagation. Triggering effect for this animation is the simple curiosity of what would happen if a point source was embedded in the PML rather than the inner domain.
To illustrate this, we utilized the uniaxial PML (UPML) formulation in a 2D FDTD scenario in homogeneous medium. We present three parallel simulations in which the point sources are located (left) deep inside the PML, (middle) slightly inside the PML and (right) outside but close to the PML. As can be observed, the PML performs great in eliminating portions of the wave impinging normal (or close to the normal) to the PML surface. But for high oblique incidences, the decaying of the wave is not completely satisfied.
For the leftmost case where the source is deeply embedded in the PML, the wave cannot propagate in the -x and +x directions and quickly decay in both directions. However, along the -/+ y directions, the PML acts as a waveguide. Thanks to the upper and lower PML regions, the wave inside the PML continues to decay along the -/+ y directions.
Total Field / Scattered Field (TF/SF) Implementation in FDTD
Here, the plane wave excitation using the total field / scattered field (TF/SF) formulation in finite-difference time-domain (FDTD) algorithm is demonstrated. The interface between the "total" and "scattered" field regions is shown using the square box. The plane wave polarized in the -z direction (with respect to screen surface) is injected into the medium along the -y direction and then the scattering phenomena from two different scatterers (one metallic triangular wedge and another circular dielectric scatterer) are animated. The reflected wavefronts from the scatterers can explicitly be observed in the scattered field regions, whereas total field is observed within the box.
Keywords: Scattering from prism, 三角柱, Prisme triangulaire, 삼각기둥,முப்பட்டகம், Триъгълна призма
Saturday, February 15, 2014
Group Velocity / Phase Velocity Animation - Case 2: Zero Group Velocity
In this second video of the series, we demonstrate the case where the group velocity is zero while the phase velocity is positive number. The individual wave components comprising the total wave are first shown at the top along with a corresponding "dot" representing the phase velocity of each component.
In the bottom figure, we have the resulting wave that travels along the +x direction with a positive phase velocity but the group velocity remains to be zero. The wave packet envelope is shown in magenta color in dashed lines.
For the other videos in the series, check the below links:
1) Group Velocity larger than Phase Velocity: https://www.youtube.com/watch?v=tlM9vq-bepA
Групповая скорость, Gruppengeschwindigkeit, Voortplantingssnelheid, Velocidad de grupo, Grupa rapido, Vitesse de groupe, Velocità di gruppo, 군속도, מהירות חבורה, ჯგუფური სიჩქარე, 群速度, Gruppefart, Prędkość grupowa, Групова швидкість, 群速度, Vận tốc nhóm, Grupphastighet, Grupinis greitis, Phasengeschwindigkeit, Velocidad de fase, 相速度, Vitesse d'une onde, Velocità di fase, Фазовая скорость, 位相速度
Sunday, February 02, 2014
Fast Fourier Transform (FFT) Animation using Matlab
We show the progress of Fast Fourier Transform (FFT) of a time-domain signal as it changes in time. Matlab's fft() function is used for illustration, hence it should be noted that the function is assumed to be periodic. The number of FFT point is assumed to be same as the time domain signal to prevent zero padding when the full domain is filled.
In the beginning a sinusoidal signal at 50 Hertz (1*sin(2pi*50*t)) starts to develop and slowly fills the full domain. Then, another sinusoidal signal at a higher amplitude and 100 Hertz (1.5*sin(2pi*100*t)) is added to this signal. Later, a third sinusoidal signal at 200 Hz replaces the 100 Hz one. Following this, a DC component (0 Hz) is inserted and finally, the DC component is removed. At each stage, the the development of frequency components can clearly be observed. In the frequency spectrum, first a 50Hz component starts to build up along with lower and higher frequencies. The reason for wider spectrum is the fact that sinusoidal signal fills the domain within an increasing time window (hence introduction of sinc components). Once the full domain is filled with the sinusoidal, then only 50 Hz component remains due to the fact that the signal assumes to be periodic in Matlab fft function.
Wednesday, January 01, 2014
How to change the default background color for Matlab figure?
One of the signatures of Matlab is the grayish background color it uses for its figures unless it is changed intentionally. In conference presentations or posters, one can easily detect Matlab outputs thanks to this color. For those who want to change this color right from the startup can do so by editing the default settings of Matlab. To access the default settings, type get(0,'Default') in the Matlab command line. Then, it will display all the default settings. This is how my settings are:
For our particular target of changing the default figure background, one can simply change the defaultFigureColor attribute to any desired color, e.g. to white, as follows:
get(0,'Default')

ans =

          defaultFigurePosition: [680 678 560 420]
               defaultTextColor: [0 0 0]
              defaultAxesXColor: [0 0 0]
              defaultAxesYColor: [0 0 0]
              defaultAxesZColor: [0 0 0]
          defaultPatchFaceColor: [0 0 0]
          defaultPatchEdgeColor: [0 0 0]
               defaultLineColor: [0 0 0]
    defaultFigureInvertHardcopy: 'on'
             defaultFigureColor: [0.8000 0.8000 0.8000]
               defaultAxesColor: [1 1 1]
          defaultAxesColorOrder: [7x3 double]
          defaultFigureColormap: [64x3 double]
        defaultSurfaceEdgeColor: [0 0 0]
For our particular target of changing the default figure background, one can simply change the defaultFigureColor attribute to any desired color, e.g. to white, as follows:
set(0,'defaultFigureColor',[1 1 1])
set(0,'defaultFigureColor',[0 0 0])
And here is how the outputs look when any figure is opened after the change in the default setting.
|
|
|
Subscribe to:
Posts (Atom)


